

None of these numbers proves that the company is weak. The problem is that they do not yet explain how the business works.
That was the central issue in our fictional screening of BeatQuanta AI.
The conversion rate depended on an unstated denominator
The package reported:
- 642,800 total users
- 16,420 paid customers
- 5.20% signup-to-paid conversion
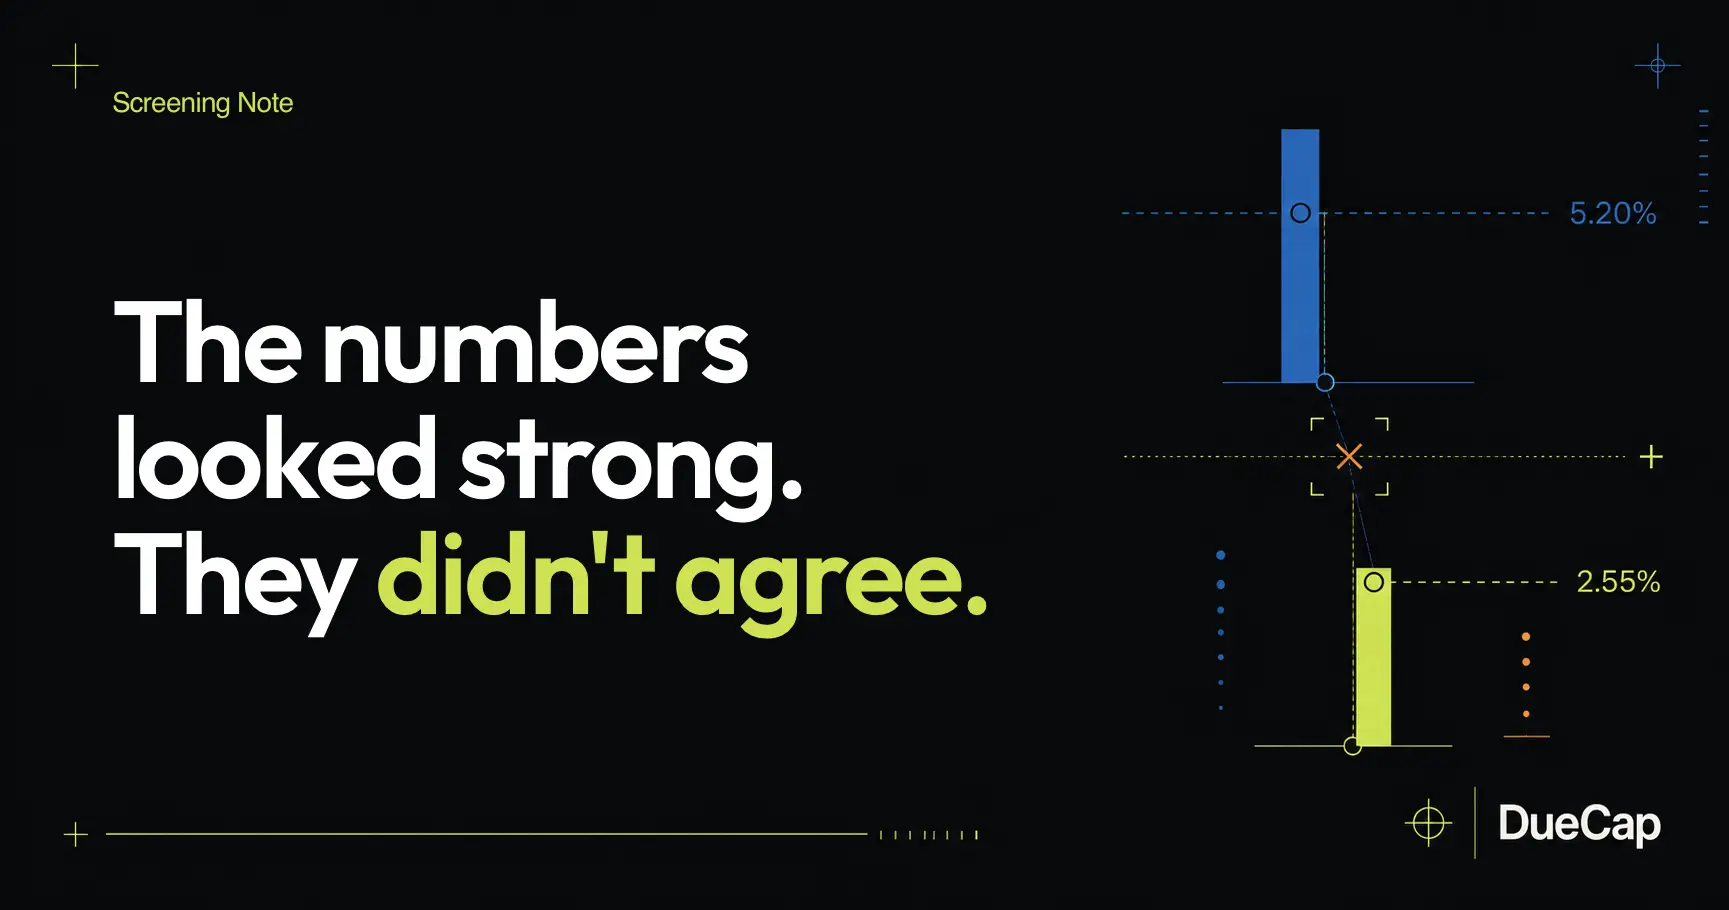
Dividing paid customers by total users produces 2.55%, not 5.20%.
This does not necessarily mean the reported conversion rate is wrong. It may refer to a particular acquisition cohort, time period, geography, channel, or definition of an eligible signup.
But none of that was specified.
Without the denominator, cohort, and measurement period, the conversion rate cannot be connected reliably to the rest of the business.
The question for the company therefore becomes specific:
Which users are included in the 5.20% conversion calculation, over what period, and how does that cohort reconcile with the reported total and paid-user figures?
MRR did not fit the reported customer and pricing data
The company reported $468,970 in MRR and 16,420 paid customers.
That produces $28.56 in MRR per paid customer.
The investment memo also reported an average plan price of $22.10, while the highest listed monthly subscription was $27.99.
Several legitimate factors could explain the difference. Revenue might include annual subscriptions, affiliate income, enterprise accounts, additional purchases, or another category not visible in the pricing table. The definition of a paid customer may also differ from the definition of a paying account.
The screening package did not provide the revenue bridge needed to determine which explanation applied.
That leads to another focused request:
Reconcile MRR to paying customers, subscription plans, annual contracts, affiliate income, B2B revenue, refunds, credits, and any non-subscription revenue included in the figure.
Growth and churn pointed in opposite directions
BeatQuanta AI reported 19.60% MRR growth in April and average monthly growth of 31% over the preceding six months.
It also reported monthly churn of 28.90%.
Both figures can be accurate at the same time. Strong acquisition can produce rapid top-line growth while a large number of existing customers continue to leave.
That distinction matters because the same MRR chart could represent two very different businesses:
- a growing base of retained customers with expanding recurring usage;
- a high-throughput funnel that continually replaces departing customers.
Headline growth cannot distinguish between them.
The screening therefore moved from asking whether the company was growing to asking what was producing that growth:
How much monthly revenue comes from new, retained, expanded, reactivated, contracted, and churned customers?
A customer and MRR bridge, supported by retention cohorts, would make the mechanism visible.
A cheap signup was not yet a complete CAC
The reported paid-ad cost was $0.86 per signup.
If that figure is divided by the reported 5.20% conversion rate, the result is an illustrative paid CAC of approximately $16.54.
But that calculation is only meaningful if the signup cost and conversion rate describe the same channels, cohorts, geographies, attribution window, and period.
It also does not include unreported creative costs, agency fees, sales costs, payment fees, refunds, overhead, or founder-led acquisition activity.
A low cost per signup can be encouraging. Whether it creates economic value depends on what happens after the signup.
The more useful request is therefore:
Show acquisition cost, conversion, retention, refunds, and contribution margin by channel and customer cohort.
The ARR multiple could not resolve the underlying questions
The reported $72 million pre-money valuation represented approximately 12.8 times the company’s stated ARR.
That calculation provides context, but it does not establish whether the valuation is attractive or excessive.
The economic quality of ARR depends on factors the package did not provide:
- retention;
- gross margin;
- compute and API costs;
- revenue recognition;
- monthly versus annual plan mix;
- customer concentration;
- acquisition payback;
- durability of demand.
A revenue multiple becomes more informative after the revenue underneath it has been reconciled.
What the screening changed
The initial screening did not produce an investment verdict.
It converted a set of attractive but disconnected metrics into a targeted evidence request:
- Reconcile total users, paid customers, and conversion using consistent definitions.
- Define exactly what the reported churn rate measures.
- Connect MRR to customers, plans, and revenue categories.
- Provide customer and revenue retention cohorts.
- Show compute costs, gross margin, contribution margin, and fully loaded acquisition economics.
- Provide monthly customer and MRR bridges showing how the business moves from one period to the next.
The full review also identified questions beyond operating performance, including the legal identity of the investment target and missing SPV documents that could affect net capital deployed, investor rights, fees, and return participation.
This is why initial screening is not simply a review of whether individual metrics look strong.
Its purpose is to determine whether the claims, definitions, calculations, and documents combine into a coherent investment case, and to identify what remains unresolved before the investor spends the founder conversation rediscovering those gaps.
The reported traction in the BeatQuanta AI example supported continued attention. The available evidence did not yet support an underwriting conclusion.
The next step was not a yes or a no.
It was a better-defined set of questions.
View the complete fictional DueCap Investment Screening Brief
BeatQuanta AI is a fictional public example. All company names, people, entities, documents, dates, and figures in the sample were invented or altered. The material does not describe an investment opportunity and does not constitute investment advice.